Nitrogen (N) management for wheat production is one of the most challenging operations that producers face. There is a fine balance between applying the proper rate of N, current and future weather conditions, economics, and potential environmental consequences. Wheat greenup has occurred throughout Kentucky, but weather conditions have limited N applications, to date. Further, any applied N has likely been subjected to prolonged soil saturation. The purpose of this article, according to Edwin Ritchey, soil and nutrient management researcher, is two-fold: 1) to discuss the amount of N loss potential from earlier applied N; and 2) to discuss N management strategies moving forward.
To understand potential N losses, we must first discuss the N sources used for wheat production. The two major N sources used for topdressing wheat are liquid urea-ammonium nitrate (UAN) and dry urea. Liquid UAN has an N concentration of 28, 30, or 32% and contains 2.99, 3.27, or 3.54 lb N/gallon of product, respectively. This product contains about 50% urea-N, 25% ammonium-N (NH4+), and 25% nitrate-N (NO3-) , each with different loss potentials and pathways. Dry urea contains 46% N, all in the urea form. Both sources of N can be treated with urease inhibitors to reduce volatile losses of ammonia (NH3) and/or nitrification inhibitors to reduce denitrification and leaching losses of nitrate-N.
The N loss mechanisms potentially impacting wheat N management in the current situation include ammonia volatilization, nitrate-N leaching, nitrate-N denitrification, which involves a series of N transformations (NO3- à NO2- à NO à N2O à N2), and loss of nitrate-N in surface runoff. Urea can easily form volatile NH3 (and be subject to loss as a gas) once applied, depending on application method and soil conditions present at application. Volatilization loss is more typical with surface applied urea than UAN, especially on high pH soils with heavy surface residue. Once urea (or NH3) contacts soil, soil acids easily provide an H+ ion, which forms NH4+ and essentially ends volatilization potential.
Nitrification is the oxidation of NH4+ to NO3- by soil microorganisms. The rate of nitrification depends on temperature, aeration, pH and soil carbon levels and proceeds more rapidly with moist, warm, well-aerated soils with a pH between 6 and 8. When soils are saturated, the nitrification process is slow to nonexistent. This is a benefit in the current wheat season on fields having received their first N application. However, any nitrate-N applied or formed prior to recent lengthy saturation events has been subject to denitrification processes and loss from the soil as either of two gasses, N2 and N2O. Soil NO3- is also subject to leaching losses because the negative charge on the NO3- anion is repelled by like charge on soil clay particles. This loss is not the dominant N loss mechanism in Kentucky unless the soil is tile drained.
Finally, if the first application of N was applied to frozen soil and a rainfall event occurred prior to soil thawing, then appreciable N runoff losses could have occurred. A similar scenario can occur with either urea or liquid UAN application followed by an intense rainfall event where the rainfall rate exceeds the soil’s water infiltration rate. Normally, a large runoff loss does not happen because soluble fertilizer N rapidly dissolves and diffuses through soil moisture deeper into the soil prior to a runoff occurrence.
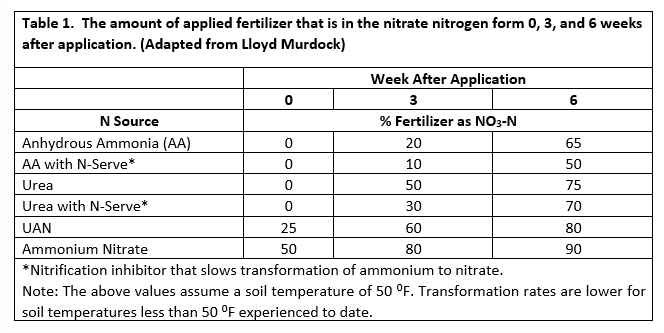
Assuming that runoff losses of N did not occur, how much of the first N application has potentially been lost? The form and rate of N applied, duration of soil saturation, and information from Table 1, are needed to estimate potential N loss. There are approximately two or three days of oxygen to sustain soil microbial activity present at the start of a soil saturation event. Denitrification begins once this oxygen is depleted. Research has shown that nitrate-N loss can range from 3-4% for each day of soil saturation, but remember that only the NO3- form is subject to denitrification loss. Below are two examples, using two different N sources. Note that Table 1 was developed for corn production and actual nitrification and denitrification rates will be lower at soil temperatures less than 50 ⁰F. The estimates below will slightly overestimate N losses due to cooler soil temperatures.
Example 1. A farmer applied 40 lb N/A as UAN in the first application. The ground wasn’t frozen or saturated and rain began three days after application. Rain continued for 6 days, the soil remained saturated for 10 days, and no N was lost due to runoff. How much N remained from this initial application? From Table 1, we can see that 25% of the UAN was in the NO3- form. The soil remained saturated for 10 days, but denitrification only occurred for 8 of those days, at a rate of 3 to 4 % loss per day. Of the initial 40 lb N/A, 40 x 0.25 = 10 lb/A N will be in the NO3- form. Assuming 3-4% loss per day for 8 days, 24-32% of the 10 lb/A of NO3- - N is lost. That equals 10 x 0.24 to 0.32 = 2.4 to 3.2 lb N/A, so in this scenario losses are minimal.
Example 2. A producer applied 50 lb N/A as urea, without an inhibitor, three weeks prior to a major rainfall event. This event saturated the soil for 12 days. Table 1 indicates that 50% of the urea N has been transformed to NO3- in the three weeks prior to the major rainfall event, giving 50 x 0.5 = 25 lb NO3- - N/A. The soil remained saturated for 12 days, but denitrification only occurred for 10 days. Assuming a 3-4% loss per day means that 30-40% of the NO3- - N or approximately 7.5-10 lb of the applied N/A was lost in this situation.
Producers that did not make an earlier N application need to decide if they are going to apply N in one application or two (split) applications. Evaluation of wheat growth stage, both crop and soil conditions, and economics are considerations in answering this question. Wheat fields that will reach growth stage Feekes 4 (pseudostem erection) or later before an N application can be made will probably not benefit from split N applications. There will be little time to utilize the added N before a second application would be needed (at Feekes 5-6), causing another field operation that would merely increase the possibility of rutting. Fields with a yield potential greater than 70 bu/A should receive 90-100 lb N/A and fields with lower yield potential should receive less (70-90 lb N/A) when making a single application. Ideally, a single application is applied at Feekes 4-5.
Producers that are able to make a split application (Feekes 2-3, then Feekes 5-6) should base the first application rate (30-50 lb N/A) on tiller counts and overall status of the crop. When tiller counts are less than 70 tillers/ft2, apply the higher rate to encourage further tillering. With tiller counts greater than 70 tillers/ft2, use the lower rate. Fields with good yield potential should receive a total spring N rate of 100-120 lb N/A. The total spring N rate for tilled fields can be reduced by 10-20 lb N/A. As mentioned previously, little N loss is expected from already applied first N applications. However, if wet weather and slow growth persist, denitrification losses will increase and adjustments may need to be considered. Be cautious and don’t over-apply N, as this increases the likelihood of disease and lodging issues. Ideally, all N should be applied by the end of Feekes 6 (jointing) to reduce N deficiency potential in the crop.
There are a limited number of “tools” that might help determine how much N has been lost from individual fields. Soil nitrate tests are of very limited use since only the NO3--N is measured and thus provides no indication of the amount of NH4+-N that is still present. Proximal canopy sensors like the Greenseeker, handheld chlorophyll meters or similar instruments that measure the growth and/or “greenness” of the wheat crop canopy can provide an indication of the N status of the crop in that field, especially if an N-rich (150 lb N/A applied at Feekes 2) strip is available for comparison. Use caution when comparing Greenseeker or chlorophyll meter results from an N-rich strip in one field to the wheat growing in other fields. Knowledge of field history, yield potential, tiller counts, and visual crop evaluation will provide meaningful information for N management decisions in 2018. For more information, please consult AGR-1: Lime and Fertilizer Recommendations, ID-125: A Comprehensive Guide to Wheat Management in Kentucky, or your local county agricultural extension agent.